


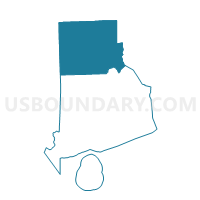
Census Tract 160, Providence County, Rhode Island
About
Outline

Summary
| Unique Area Identifier | 490332 |
| Name | Census Tract 160 |
| County | Providence County |
| State | Rhode Island |
| Area (square miles) | 0.45 |
| Land Area (square miles) | 0.43 |
| Water Area (square miles) | 0.02 |
| % of Land Area | 96.01 |
| % of Water Area | 3.99 |
| Latitude of the Internal Point | 41.88267620 |
| Longtitude of the Internal Point | -71.37576960 |
| Total Population | 3,289 |
| Total Housing Units | 1,771 |
| Total Households | 1,510 |
| Median Age | 34.2 |
Maps

Graphs
Select a template below for downloading or customizing gragh for Census Tract 160, Providence County, Rhode Island


Neighbors
Neighoring Census Tract (by Name) Neighboring Census Tract on the Map
- Census Tract 108, Providence County, RI
- Census Tract 109, Providence County, RI
- Census Tract 112, Providence County, RI
- Census Tract 152, Providence County, RI
- Census Tract 153, Providence County, RI
- Census Tract 154, Providence County, RI
- Census Tract 156, Providence County, RI
- Census Tract 159, Providence County, RI
- Census Tract 167, Providence County, RI
- Census Tract 168, Providence County, RI
- Census Tract 171, Providence County, RI
- Census Tract 6311, Bristol County, MA
Top 10 Neighboring County Subdivision (by Population) Neighboring County Subdivision on the Map
- Pawtucket city, Providence County, RI (71,148)
- Attleboro city, Bristol County, MA (43,593)
- Cumberland town, Providence County, RI (33,506)
- Central Falls city, Providence County, RI (19,376)
Top 10 Neighboring Place (by Population) Neighboring Place on the Map
- Pawtucket city, RI (71,148)
- Attleboro city, MA (43,593)
- Central Falls city, RI (19,376)
- Valley Falls CDP, RI (11,547)
Top 10 Neighboring Unified School District (by Population) Neighboring Unified School District on the Map
- Pawtucket School District, RI (71,148)
- Attleboro School District, MA (43,593)
- Cumberland School District, RI (33,506)
- Central Falls School District, RI (19,376)
Top 10 Neighboring State Legislative District Lower Chamber (by Population) Neighboring State Legislative District Lower Chamber on the Map
- Second Bristol District, MA (39,600)
- State House District 56, RI (15,018)
- State House District 57, RI (14,860)
- State House District 62, RI (14,595)
- State House District 60, RI (14,228)
- State House District 59, RI (13,750)
Top 10 Neighboring State Legislative District Upper Chamber (by Population) Neighboring State Legislative District Upper Chamber on the Map
- Norfolk, Bristol & Middlesex District, MA (169,111)
- State Senate District 16, RI (28,364)
- State Senate District 15, RI (28,092)
- State Senate District 8, RI (26,975)
Top 10 Neighboring 111th Congressional District (by Population) Neighboring 111th Congressional District on the Map
Top 10 Neighboring 5-Digit ZIP Code Tabulation Area (by Population) Neighboring 5-Digit ZIP Code Tabulation Area on the Map
Explore Neighbors on the MapData
Demographic, Population, Households, and Housing Units
** Data sources from census 2010 **
Show Data on Map
Download Full List as CSV
Download Quick Sheet as CSV
| Subject | This Area | Providence County | Rhode Island | National |
|---|---|---|---|---|
| POPULATION | ||||
| Total Population Map | 3,289 | 626,667 | 1,052,567 | 308,745,538 |
| POPULATION, HISPANIC OR LATINO ORIGIN | ||||
| Not Hispanic or Latino Map | 2,509 | 508,848 | 921,912 | 258,267,944 |
| Hispanic or Latino Map | 780 | 117,819 | 130,655 | 50,477,594 |
| POPULATION, RACE | ||||
| White alone Map | 1,962 | 460,033 | 856,869 | 223,553,265 |
| Black or African American alone Map | 593 | 53,040 | 60,189 | 38,929,319 |
| American Indian and Alaska Native alone Map | 32 | 4,123 | 6,058 | 2,932,248 |
| Asian alone Map | 43 | 23,006 | 30,457 | 14,674,252 |
| Native Hawaiian and Other Pacific Islander alone Map | 5 | 420 | 554 | 540,013 |
| Some Other Race alone Map | 444 | 59,862 | 63,653 | 19,107,368 |
| Two or More Races Map | 210 | 26,183 | 34,787 | 9,009,073 |
| POPULATION, SEX | ||||
| Male Map | 1,569 | 302,382 | 508,400 | 151,781,326 |
| Female Map | 1,720 | 324,285 | 544,167 | 156,964,212 |
| POPULATION, AGE (18 YEARS) | ||||
| 18 years and over Map | 2,518 | 489,042 | 828,611 | 234,564,071 |
| Under 18 years | 771 | 137,625 | 223,956 | 74,181,467 |
| POPULATION, AGE | ||||
| Under 5 years | 254 | 37,376 | 57,448 | 20,201,362 |
| 5 to 9 years | 189 | 36,992 | 60,440 | 20,348,657 |
| 10 to 14 years | 193 | 37,818 | 63,824 | 20,677,194 |
| 15 to 17 years | 135 | 25,439 | 42,244 | 12,954,254 |
| 18 and 19 years | 90 | 23,407 | 37,802 | 9,086,089 |
| 20 years | 49 | 12,603 | 19,537 | 4,519,129 |
| 21 years | 39 | 12,011 | 18,508 | 4,354,294 |
| 22 to 24 years | 197 | 28,724 | 44,122 | 12,712,576 |
| 25 to 29 years | 276 | 43,882 | 65,799 | 21,101,849 |
| 30 to 34 years | 257 | 39,904 | 61,163 | 19,962,099 |
| 35 to 39 years | 234 | 39,393 | 63,730 | 20,179,642 |
| 40 to 44 years | 267 | 43,113 | 73,130 | 20,890,964 |
| 45 to 49 years | 248 | 45,882 | 81,300 | 22,708,591 |
| 50 to 54 years | 217 | 45,268 | 81,050 | 22,298,125 |
| 55 to 59 years | 196 | 38,682 | 70,634 | 19,664,805 |
| 60 and 61 years | 52 | 13,479 | 25,250 | 7,113,727 |
| 62 to 64 years | 83 | 18,305 | 34,705 | 9,704,197 |
| 65 and 66 years | 47 | 9,777 | 18,483 | 5,319,902 |
| 67 to 69 years | 53 | 12,909 | 24,319 | 7,115,361 |
| 70 to 74 years | 55 | 17,128 | 31,077 | 9,278,166 |
| 75 to 79 years | 53 | 14,866 | 26,645 | 7,317,795 |
| 80 to 84 years | 67 | 14,089 | 24,607 | 5,743,327 |
| 85 years and over | 38 | 15,620 | 26,750 | 5,493,433 |
| MEDIAN AGE BY SEX | ||||
| Both sexes Map | 34.20 | 37.00 | 39.40 | 37.20 |
| Male Map | 33.20 | 35.30 | 37.80 | 35.80 |
| Female Map | 35.20 | 38.60 | 40.80 | 38.50 |
| HOUSEHOLDS | ||||
| Total Households Map | 1,510 | 241,717 | 413,600 | 116,716,292 |
| HOUSEHOLDS, HOUSEHOLD TYPE | ||||
| Family households: Map | 756 | 149,691 | 259,561 | 77,538,296 |
| Husband-wife family Map | 354 | 98,652 | 183,904 | 56,510,377 |
| Other family: Map | 402 | 51,039 | 75,657 | 21,027,919 |
| Male householder, no wife present Map | 95 | 12,799 | 19,694 | 5,777,570 |
| Female householder, no husband present Map | 307 | 38,240 | 55,963 | 15,250,349 |
| Nonfamily households: Map | 754 | 92,026 | 154,039 | 39,177,996 |
| Householder living alone Map | 617 | 73,103 | 122,488 | 31,204,909 |
| Householder not living alone Map | 137 | 18,923 | 31,551 | 7,973,087 |
| HOUSEHOLDS, HISPANIC OR LATINO ORIGIN OF HOUSEHOLDER | ||||
| Not Hispanic or Latino householder: Map | 1,245 | 208,254 | 376,946 | 103,254,926 |
| Hispanic or Latino householder: Map | 265 | 33,463 | 36,654 | 13,461,366 |
| HOUSEHOLDS, RACE OF HOUSEHOLDER | ||||
| Householder who is White alone | 1,026 | 190,637 | 354,090 | 89,754,352 |
| Householder who is Black or African American alone | 230 | 17,959 | 20,488 | 14,129,983 |
| Householder who is American Indian and Alaska Native alone | 15 | 1,378 | 2,060 | 939,707 |
| Householder who is Asian alone | 21 | 6,724 | 8,987 | 4,632,164 |
| Householder who is Native Hawaiian and Other Pacific Islander alone | 2 | 131 | 164 | 143,932 |
| Householder who is Some Other Race alone | 147 | 17,767 | 18,784 | 4,916,427 |
| Householder who is Two or More Races | 69 | 7,121 | 9,027 | 2,199,727 |
| HOUSEHOLDS, HOUSEHOLD TYPE BY HOUSEHOLD SIZE | ||||
| Family households: Map | 756 | 149,691 | 259,561 | 77,538,296 |
| 2-person household Map | 307 | 58,370 | 108,020 | 31,882,616 |
| 3-person household Map | 216 | 37,689 | 63,618 | 17,765,829 |
| 4-person household Map | 125 | 30,737 | 52,498 | 15,214,075 |
| 5-person household Map | 57 | 14,063 | 22,776 | 7,411,997 |
| 6-person household Map | 37 | 5,425 | 8,043 | 3,026,278 |
| 7-or-more-person household Map | 14 | 3,407 | 4,606 | 2,237,501 |
| Nonfamily households: Map | 754 | 92,026 | 154,039 | 39,177,996 |
| 1-person household Map | 617 | 73,103 | 122,488 | 31,204,909 |
| 2-person household Map | 130 | 15,255 | 25,493 | 6,360,012 |
| 3-person household Map | 7 | 2,331 | 3,721 | 992,156 |
| 4-person household Map | 0 | 834 | 1,512 | 411,171 |
| 5-person household Map | 0 | 307 | 538 | 126,634 |
| 6-person household Map | 0 | 128 | 189 | 48,421 |
| 7-or-more-person household Map | 0 | 68 | 98 | 34,693 |
| HOUSING UNITS | ||||
| Total Housing Units Map | 1,771 | 264,835 | 463,388 | 131,704,730 |
| HOUSING UNITS, OCCUPANCY STATUS | ||||
| Occupied Map | 1,510 | 241,717 | 413,600 | 116,716,292 |
| Vacant Map | 261 | 23,118 | 49,788 | 14,988,438 |
| HOUSING UNITS, OCCUPIED, TENURE | ||||
| Owned with a mortgage or a loan Map | 312 | 96,950 | 185,168 | 52,979,430 |
| Owned free and clear Map | 78 | 33,418 | 65,784 | 23,006,644 |
| Renter occupied Map | 1,120 | 111,349 | 162,648 | 40,730,218 |
| HOUSING UNITS, VACANT, VACANCY STATUS | ||||
| For rent Map | 168 | 10,957 | 15,763 | 4,137,567 |
| Rented, not occupied Map | 4 | 418 | 727 | 206,825 |
| For sale only Map | 26 | 2,864 | 5,171 | 1,896,796 |
| Sold, not occupied Map | 0 | 696 | 1,219 | 421,032 |
| For seasonal, recreational, or occasional use Map | 8 | 1,507 | 17,077 | 4,649,298 |
| For migrant workers Map | 0 | 8 | 12 | 24,161 |
| Other vacant Map | 55 | 6,668 | 9,819 | 3,652,759 |
| HOUSING UNITS, OCCUPIED, AVERAGE HOUSEHOLD SIZE BY TENURE | ||||
| Total: Map | 2.17 | 2.48 | 2.44 | 2.58 |
| Owner occupied Map | 2.32 | 2.64 | 2.59 | 2.65 |
| Renter occupied Map | 2.12 | 2.29 | 2.21 | 2.44 |
| HOUSING UNITS, OCCUPIED, TENURE BY RACE OF HOUSEHOLDER | ||||
| Owner occupied: Map | 390 | 130,368 | 250,952 | 75,986,074 |
| Householder who is White alone Map | 293 | 114,662 | 231,315 | 63,446,275 |
| Householder who is Black or African American alone Map | 32 | 5,583 | 6,559 | 6,261,464 |
| Householder who is American Indian and Alaska Native alone Map | 2 | 318 | 596 | 509,588 |
| Householder who is Asian alone Map | 12 | 2,809 | 4,230 | 2,688,861 |
| Householder who is Native Hawaiian and Other Pacific Islander alone Map | 0 | 35 | 49 | 61,911 |
| Householder who is Some Other Race alone Map | 34 | 4,642 | 5,014 | 1,975,817 |
| Householder who is Two or More Races Map | 17 | 2,319 | 3,189 | 1,042,158 |
| Renter occupied: Map | 1,120 | 111,349 | 162,648 | 40,730,218 |
| Householder who is White alone Map | 733 | 75,975 | 122,775 | 26,308,077 |
| Householder who is Black or African American alone Map | 198 | 12,376 | 13,929 | 7,868,519 |
| Householder who is American Indian and Alaska Native alone Map | 13 | 1,060 | 1,464 | 430,119 |
| Householder who is Asian alone Map | 9 | 3,915 | 4,757 | 1,943,303 |
| Householder who is Native Hawaiian and Other Pacific Islander alone Map | 2 | 96 | 115 | 82,021 |
| Householder who is Some Other Race alone Map | 113 | 13,125 | 13,770 | 2,940,610 |
| Householder who is Two or More Races Map | 52 | 4,802 | 5,838 | 1,157,569 |
| HOUSING UNITS, OCCUPIED, TENURE BY HISPANIC OR LATINO ORIGIN OF HOUSEHOLDER | ||||
| Owner occupied: Map | 390 | 130,368 | 250,952 | 75,986,074 |
| Not Hispanic or Latino householder Map | 350 | 121,764 | 240,966 | 69,617,625 |
| Hispanic or Latino householder Map | 40 | 8,604 | 9,986 | 6,368,449 |
| Renter occupied: Map | 1,120 | 111,349 | 162,648 | 40,730,218 |
| Not Hispanic or Latino householder Map | 895 | 86,490 | 135,980 | 33,637,301 |
| Hispanic or Latino householder Map | 225 | 24,859 | 26,668 | 7,092,917 |
| HOUSING UNITS, OCCUPIED, TENURE BY HOUSEHOLD SIZE | ||||
| Owner occupied: Map | 390 | 130,368 | 250,952 | 75,986,074 |
| 1-person household Map | 128 | 28,516 | 54,568 | 16,453,569 |
| 2-person household Map | 145 | 44,997 | 90,849 | 27,618,605 |
| 3-person household Map | 46 | 23,298 | 43,883 | 12,517,563 |
| 4-person household Map | 36 | 20,154 | 38,232 | 10,998,793 |
| 5-person household Map | 17 | 8,454 | 15,462 | 5,057,765 |
| 6-person household Map | 14 | 3,102 | 5,179 | 1,965,796 |
| 7-or-more-person household Map | 4 | 1,847 | 2,779 | 1,373,983 |
| Renter occupied: Map | 1,120 | 111,349 | 162,648 | 40,730,218 |
| 1-person household Map | 489 | 44,587 | 67,920 | 14,751,340 |
| 2-person household Map | 292 | 28,628 | 42,664 | 10,624,023 |
| 3-person household Map | 177 | 16,722 | 23,456 | 6,240,422 |
| 4-person household Map | 89 | 11,417 | 15,778 | 4,626,453 |
| 5-person household Map | 40 | 5,916 | 7,852 | 2,480,866 |
| 6-person household Map | 23 | 2,451 | 3,053 | 1,108,903 |
| 7-or-more-person household Map | 10 | 1,628 | 1,925 | 898,211 |
Loading...